Work / Meridian Energy
Half a million data points, one readable dashboard
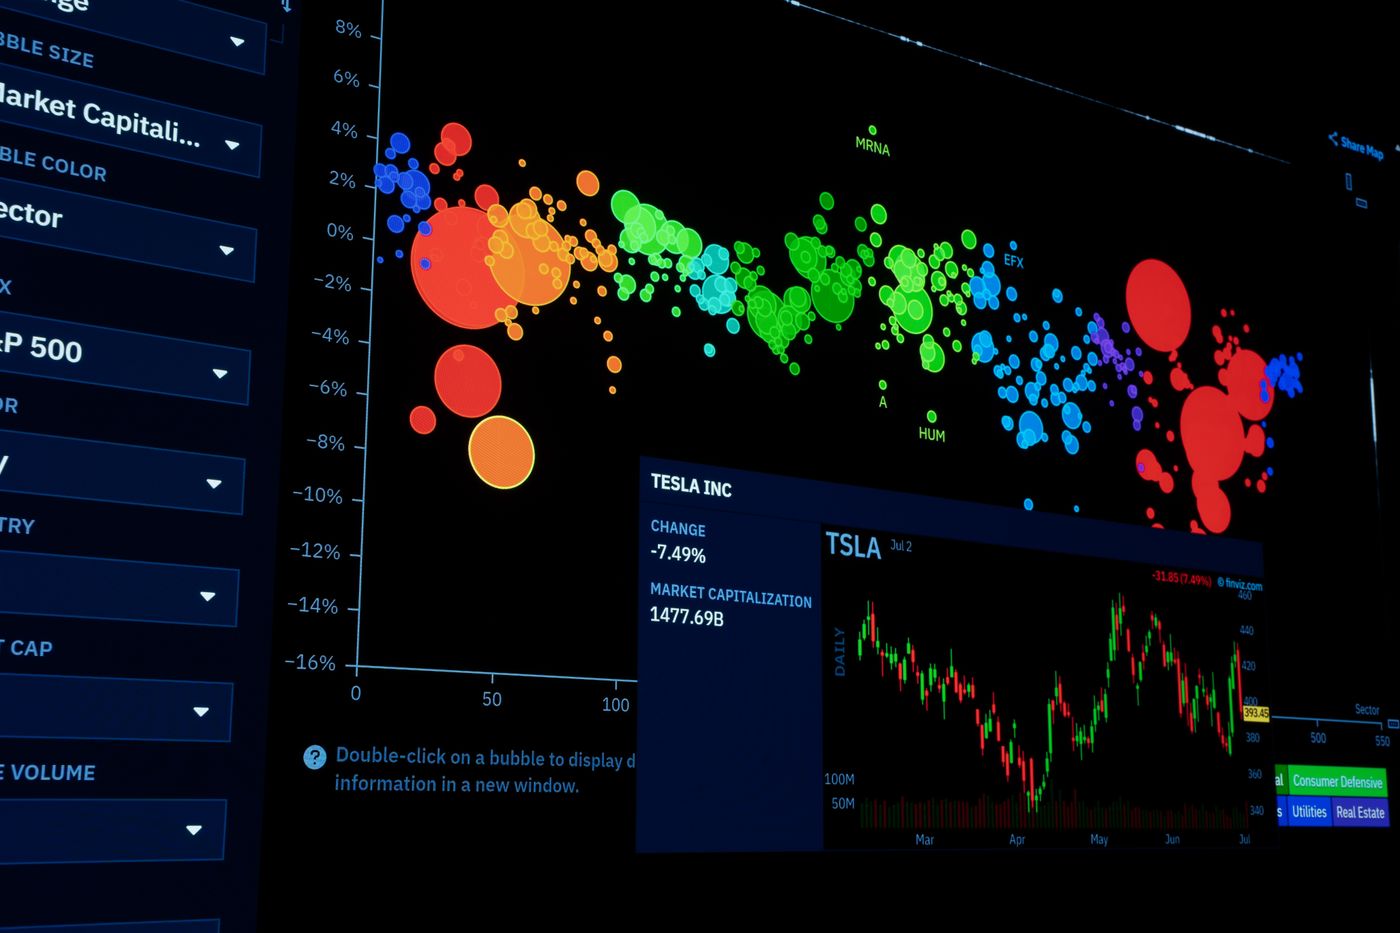
Live grid telemetry rendered in the browser without the page ever stuttering, on infrastructure that scales itself down overnight.
- Client
- Meridian Energy
- Year
- 2024
- Duration
- 16 weeks
- Services
- Web Development · Cloud & DevOps
- Stack
- React, D3, TimescaleDB, Terraform, AWS
The problem
Meridian Energy came to us with a process that worked when the company was a third of its current size and had quietly stopped scaling. The people doing the work had built their own workarounds, and none of them talked to each other.
What we did
We spent the first fortnight watching the job being done rather than writing requirements, then designed around what we saw. The build ran in two-week cycles with a working environment from day one.
- Data architecture
- React dashboard
- Terraform / AWS
Where it landed
The numbers below are measured against the six months before launch. More to the point, the workarounds are gone.
<200ms
median query time
41%
lower cloud spend
99.98%
uptime since launch